Wednesday, March 12, 2014

Exercise 7: Introduction to Unmanned Aerial Systems

For this week's exercise we assembled out in the field to experience unmanned aerial systems up close and personal. Joe Hupy and Max demonstrated how to operate the controls of the UAS units and the differences between the two builds. Max's rotary unit had 6 arms with a propeller on each, while Joe's rotary unit had 3 arms with 2 propellers on each (Figure 1.). Both units had a similar maximum speed and a flight duration of 15 minutes. The two units had exceptional agility while performing high speed maneuvers and great stability when hovering (Figure 2.). Joe's unit was equipped with a digital camera attached to a gimbal stabilizer. This allowed the camera to stay level no matter the orientation of the UAS. This function is highly useful for windy conditions that would usually alter the alignment and angle of the camera.

Figure 1. Max's 6 armed UAS on the left and Joe's 3 armed UAS on the right. Each unit has 6 propellers and a flight time of 15 minutes. 


Figure 2. Max flying his unit a foot above the surface. Rotary wing units are extremely agile and stable.
The next unit in the demonstration was a high altitude kite (Figure 3.). The kite is useful for windy conditions that a UAS vehicle or a balloon would not be able to handle. By attaching a digital camera to the kite string via gimbal, aerial images can be collected with ease. The camera was set to take a picture every second for 2 minutes, providing the operator with plenty of time to get the kite to the desired altitude for data collection. Altitude of the imagery can be altered by simply raising or lowering the kite, and shifting the imagery to the side only requires the kite controller to walk to the desired location. These kites can collect data from hundreds of feet in the air and only require a bit of wind to operate (Figure 4.)

Figure 3. This high altitude kite is very affordable and perfect for collecting data on a windy day. 

Figure 4. The kite was equipped with a hanging digital camera to take aerial images during the flight. 
The grand finale of the demonstration included a rocket launch. Two small video cameras the size of key-chains were attached to the rocket via tape to record both the ascend and descend of the rocket (Figure 5.). Unfortunately, upon launch the rocket engines were loaded in improperly and caused the rocket to only fly about 100 feet upwards. A successful launch should have yielded altitudes of 3 to 4 times greater than our results, but we will have to wait for better weather to schedule a relaunch. 


Figure 5. Joe attaching the small video cameras to the fuselage of the rocket. Had the launch gone according to plan, two different angles of the ascend and descend would have been recorded. 

This demonstration of various UAS data collection techniques displayed the huge potential within this field. Using UAS to collect data is far cheaper, faster, simpler, and much more efficient for today's purposes. I am truly excited to work in such a new field and contribute to the growing success of unmanned aerial systems. 

Sunday, March 9, 2014

Exercise 6: Creating a Geodatabase

Why use Geodatabases and Domains?

GIS professionals use a lot of data that is typically stored in multiple sets of files. By using a geodatabase to store these files, they seamlessly share the same properties such as coordinate system, projection, and map units.  Domains help GIS professionals collect data quickly and efficiently without altering the data with human error. By setting up this infrastructure before the data is collected, much time can be saved both out in the field and afterwards in the lab when the data would need to be organized for analysis. 

In the near future, an exercise involving a microclimate map for the University of Wisconsin-Eau Claire will be conducted. Until the weather becomes more inviting, the most we can do is prepare a geodatabase and create specific domains to assist us during data collection and analysis. Variables we will be collecting include temperature, wind speed and direction, snow depth, dew point, and humidity. Each of these variables are recorded and formatted in different methods which means that domains will be need to be used to keep the values orderly. Temperature and dew point are recorded in integers, and it is safe to assume that the temperature on a given day will fall somewhere between -20 degrees Fahrenheit and 99 degrees Fahrenheit. In this case, a Float-Range domain will be created to only accept temperature values within the provided ranges. Wind direction can be collected in two formats, cardinal directions and azimuth bearing. When collecting the cardinal directions, a Text-Coded Values domain will be used to translate N to North, NW to Northwest, etc. Bearing azimuth is collected in degrees ranging from 0 to 360, and will utilizing a similar domain to that of temperature. Snow depth and humidity will be collected in amounts that could require decimal places, which makes Float the proper domain of choice. By creating a feature class utilizing these domains, data collection will be swift and unbiased by human error. 

Tutorial

This tutorial will explain how to create a geodatabase, create domains, and apply them to a new feature class within ArcMap 10.2.

A geodatabase is a collection of geographic datasets of various types, including feature classes, feature datasets, raster datasets, network datasets, tables, and more. The first step of creating a geodatabase within ArcMap 10.2 is to connect to the folder in which the new geodatabase will be located. Once the desired location is found, simply right click the folder and select New-File Geodatabase (Figure 1.). 


Figure 1. Many options regarding the geodatabase appear when the cursor right clicks the icon. 


Domains are rules that describe the legal values of a field type, providing a method for enforcing data integrity. For the purposes of this exercise, we are going to set domains that will help us collect accurate weather recordings for a microclimate map. To create a domain, right click the geodatabase and select Properties at the bottom of the drop down menu, and select the Domains tab inside the Geodatabase Properties window (Figure 2.). The top of the window shows two columns, one titled Domain Name and one titled Description. To create a domain, simply type a fitting name into the Domain Name column. A description is not necessary, it is only there to help you remember what the domain is to be used for. 

Figure 2. By opening the Properties of a geodatabase, the domains can be created and edited.


The first domain we will create for this exercise is one regarding rules for temperature values. The Temperature domain will be set to the Float field type because our temperature readings may contain decimals. By setting the domain type to Range, we can choose minimum and maximum values to set boundaries on our data. Taking dew point measurements into account, the minimum temperature value will be -20 degrees Fahrenheit and the maximum value will be 99 degrees (Figure 3.). This domain will be applied for both surface air temperature recordings and dew point temperature recordings. 


Figure 3. This domain will regulate values that represent temperature recordings. 


Another important domain needed to be created is one regarding time data. The time of each feature point will be recorded in a field titled Time. This field will require a domain that limits input values to the extent of military time. With the minimum value set to 0 and the maximum value set to 2400, an integer field type such as Short or Long can be used to allow whole numbers only (Figure 4.).


Figure 4. Integer field types are great for measurements with no fractions or decimals like time. 


Another domain we will use for the microclimate data collection will apply to wind direction data. This domain will have a Text field type and a Coded Values domain type. The use of coded values will allow us to simply type "NW" and the domain will recognize it as "Northwest". To create these associations, type a short code into the Code column and type the corresponding description in the Description column (Figure 5.). 

Figure 5. Coded values allow for quick and accurate data entry out in the field while minimizing human error. 


Once all of the desired domains have been created, simply press OK to close the window. In order to create a feature class, right click on the geodatabase that was created earlier and select New-Feature Class... (Figure 6.). For the microclimate exercise, we will be plotting individual points, causing Point Feature Class to be the desired feature class type. Near the end of the wizard, a window displaying field names and data types will be used to create fields and apply the domains we created earlier. I have created a field called Temperature and set the data type to Float. At the bottom of the window, a drop down menu reveals the domains that apply to float data types (Figure 7.). Simply select the corresponding domain and the newly created field will follow the rules set within the domain. 


Figure 6. Creating a new feature class from scratch allows the user to set specified domains and subtypes. 


Figure 7. Domains will not be applied to fields unless they are chosen within the drop down menu shown above. 


The final step of this tutorial explains how to import a raster into a geodatabase. Right click the geodatabase and select Import-Raster Datasets...(Figure 8.). A file explorer will appear and allow you to locate the desired raster. 


Figure 8. By right clicking the geodatabase icon, feature classes, tables, and rasters can be imported. 

Tuesday, March 4, 2014

Exercise 5: Orienteering Preparation

Introduction

Continuing the trend of "old-school" field methods from last week, this week we took a look at the basics of orienteering using only a map and a compass. These skills are the foundation of any type of physical geography techniques and are extremely helpful when modern technology cannot be used. Al Wiberg from the Environmental Adventure Center at UWEC visited our lab to give us a workshop on the basics of orienteering. The goal of the workshop was to prepare us for a future class activity in which we will be navigating to various points at the Priory, an annexed housing property of UWEC. The study area contains rough terrain and many obstacles, making learning the basic skills of orienteering extremely important. The first portion of this exercise included finding our pace count, learning how to operate a compass, and creating a topographic map in order to navigate the course at the Priory.
 

Methods


Pace Count

In order to find your pace count, you simply walk straight for 100 meters, keeping every stride consistent in length. This pace should be comfortable and repeatable in the field in order to measure distance accurately. While walking the 100 meter distance, count each step with the same foot, not both feet. For example, I only counted the steps with my left foot and I counted a total of 66 strides for the 100 meter distance. Most pace counts are found in the mid to high 60's, with taller people needing less paces and shorter people needing more.  It is recommended to measure your pace count multiple times in order to acquire the most accurate rate. This pace count will be used in the field in conjunction with the map scale bar in order to keep track of the distance traveled, which is crucial information while traversing through terrain with only a map and compass. Al taught us to hold a small twig and break off a piece each time you reached 100 meters according to your pace count. If there is ever confusion about how far you traveled, simply count the pieces of twig that you have in your pocket and the distance can be estimated from there. 


Compass Basics

Once the pace count was calculated, the next step was to learn how to navigate with one of our resources, the compass. The terms used in the following instructions can be found on Figure 1. The first step in using a compass for navigation is understanding the starting point and the destination. It is useful to draw a line using the straightedge of the compass to connect the two locations. Once the line is drawn, place the center of the dial on top of the starting point and rotate the entire device so that the direction of travel arrow faces the destination and sits directly on top of the drawn line. Next, rotate the rotating housing to face true north. Meridian lines on the housing and the map grid should help to align the orienting arrow to face North (at this point magnetic declination should be taken into account, but to due Eau Claire's location declination isn't a significant issue). Examine the azimuth degree values along the rotating housing and find the value that lines up with the direction of travel arrow. This will give you the azimuth bearing to your destination. To navigate from the starting point to the destination, simply keep the magnetic needle inside the orienting arrow (red shed) and begin walking in the direction of travel. 
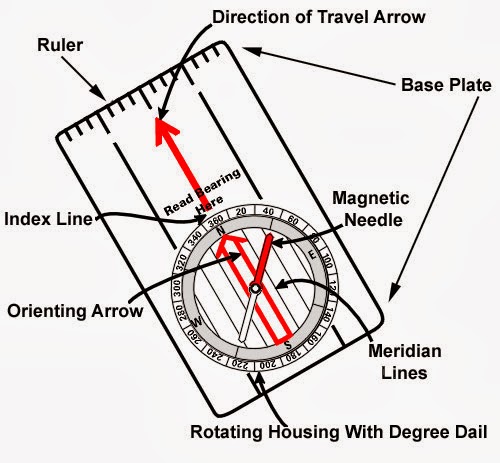
Figure 1. A compass has many measurements and components to help travelers navigate to their destination with ease.


Map with Grid System

To properly navigate the terrain, a map is the second resource we will be using in the field. It is important that the map includes the entire study area but also includes enough detail at the same time. Since most of the landscape looks like a forest, it is important to include elevation contour lines in order to find the differences in the terrain while we are on the ground. Once the contour lines were placed on top of an aerial image of the study area, the final component to include were the grid lines. Two maps were created for the exercise, one map measuring location using the Universal Transverse Mercator (UTM) System, and the other using decimal degrees. The UTM system uses a 2-dimensional coordinate system to give locations on the surface of the Earth according to meridians created by 60 zones around the planet (Figure 2.). Decimal degrees express latitude and longitude as decimal fractions instead of degrees, minutes, and seconds. Positive latitudes are north of the equator while positive longitudes are east of the Prime Meridian (Figure 3.). 
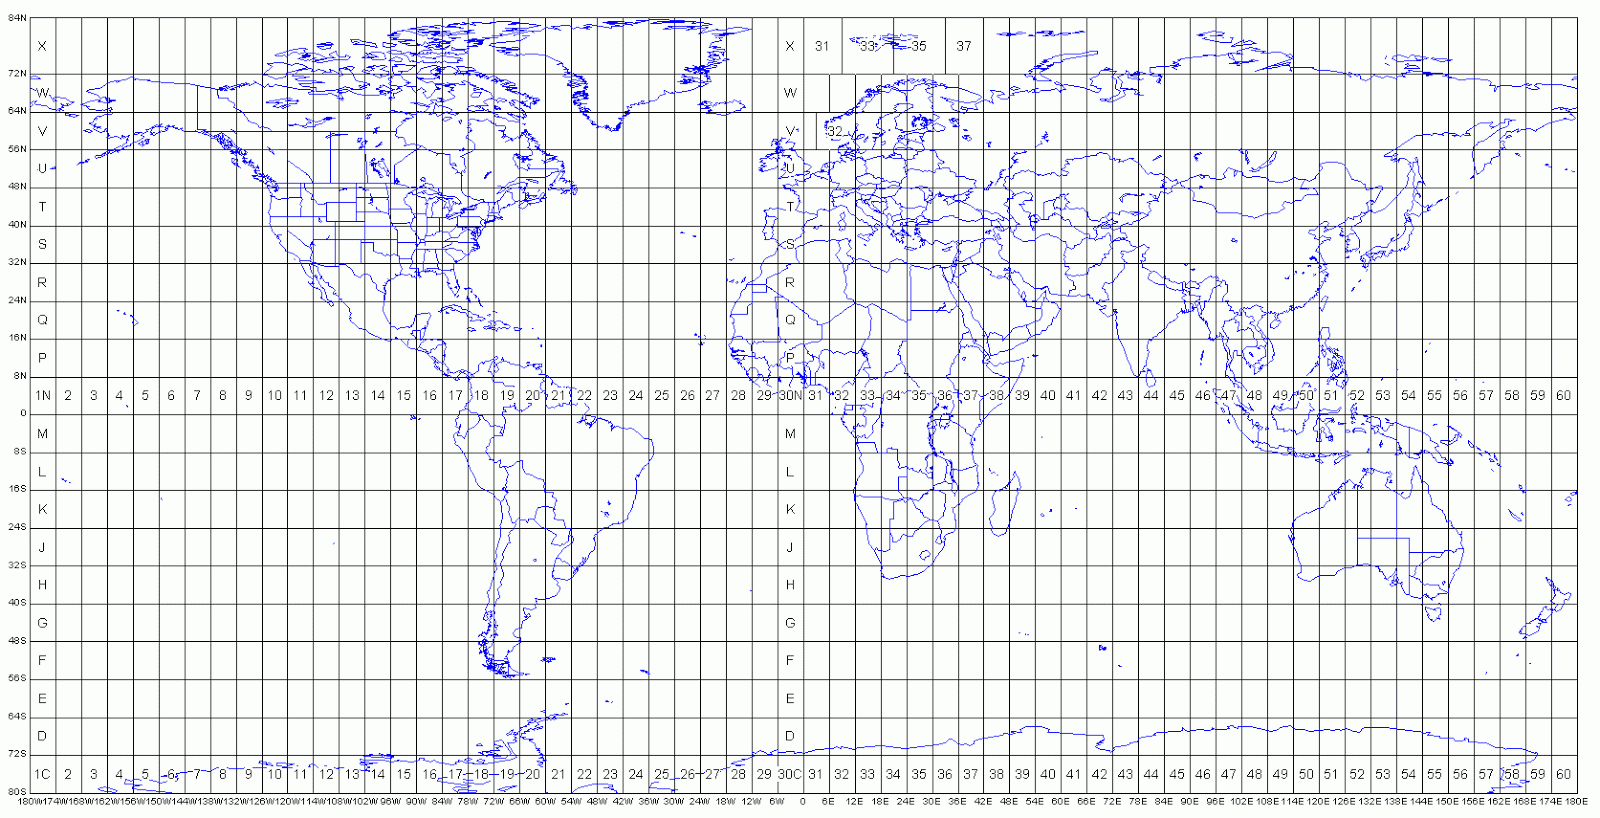
Figure 2. The planet is divided into 60 vertical zones within the UTM system. Eau Claire is located in the northern section of UTM zone 15. 

Figure 3. In the decimal degrees system, coordinates are written as decimal values instead of using degrees, minutes, and seconds. The decimal degree location of Eau Claire is (44.8167 N, 91.5000 W).

Results

The maps created for the navigational exercise look identical besides the grid system that is being placed above the surface data. Figure 4 is the map containing the UTM grid and Figure 5 contains the decimal degrees system. The 2 foot contour lines were colored bright pink in order to distinguish them from the dark basemap and grid lines. 
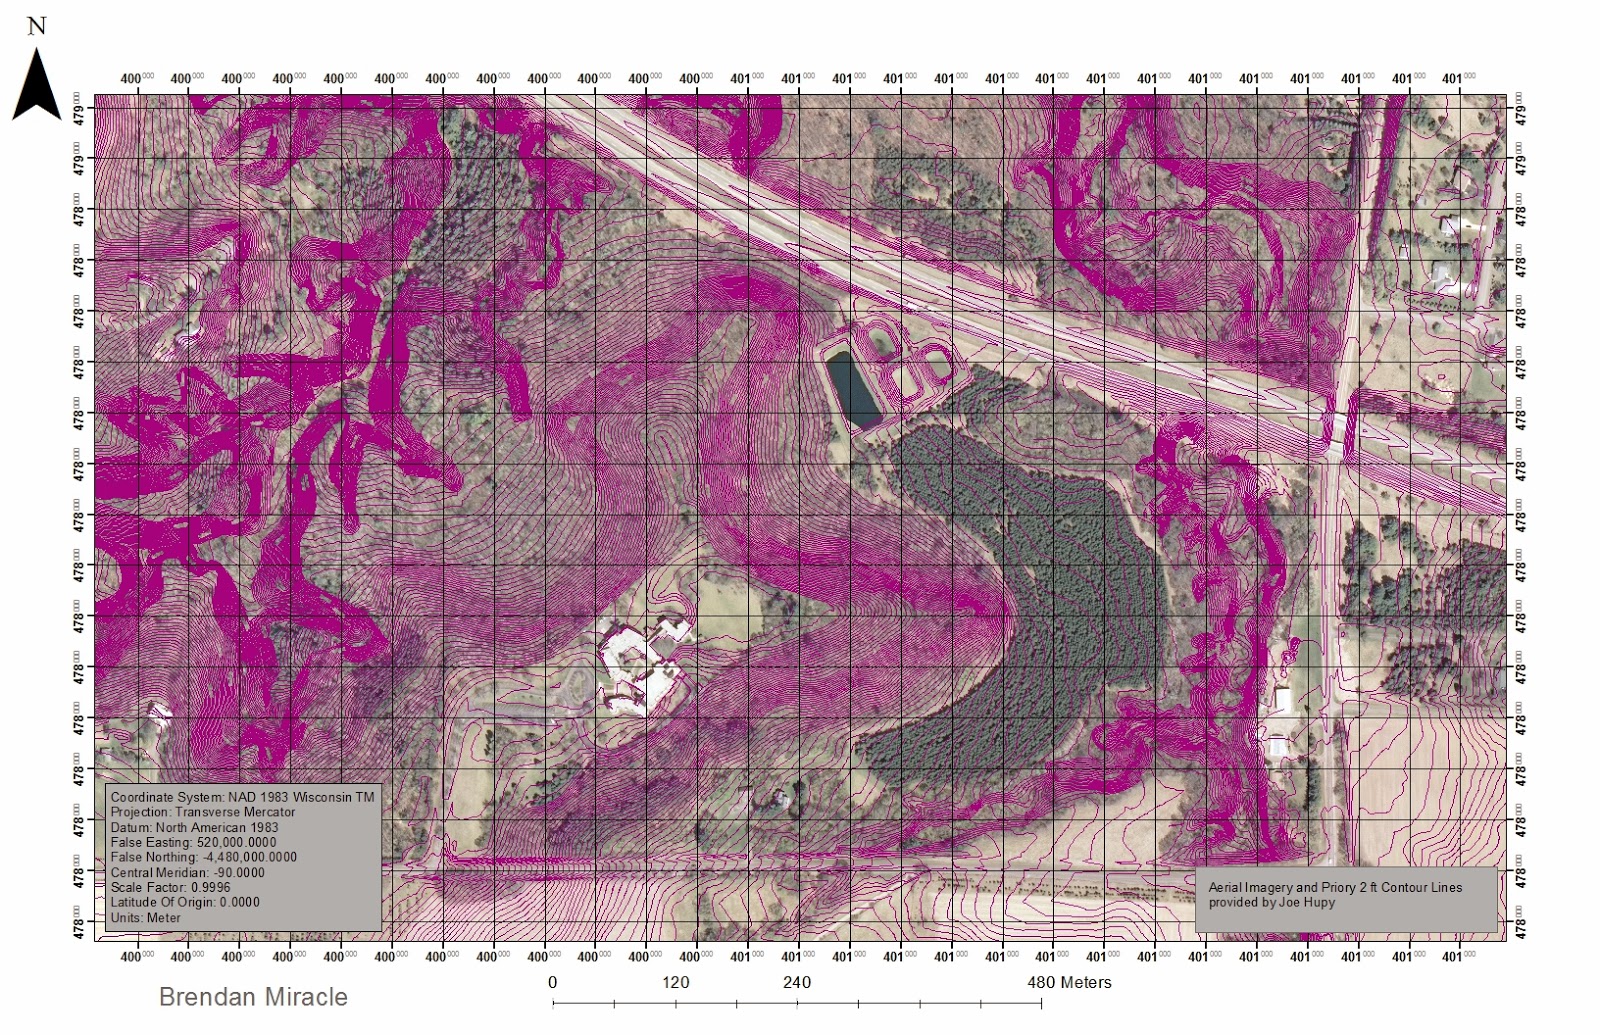
Figure 4. This map displays the Priory area with 2 foot contour lines under a UTM grid.

Figure 5. This map displays the Priory area with 2 foot contour lines under a decimal degrees grid.