Sunday, April 27, 2014

Exercise 10: Unmanned Aerial Systems

Introduction

With the introduction of Unmanned Aerial Systems, the geospatial field has exploded into endless opportunities for data collection methods. The following exercise includes multiple occasions of UAS operation and the different type of data and aerial imagery that can be collected with them. Different UAS devices are more suitable for different environments and weather conditions, and this exercise is an attempt to familiarize ourselves with the various techniques used for collected geospatial data using a variety of UAS devices. 

Methods

The study area for these exercises was the soccer park south of Clairemont Ave. This area provided a large open space that minimized the chance of something going wrong during the UAS missions. 

The first mission we completed involved sending a large balloon hundreds of feet into the air and attaching a digital camera in order to collect aerial imagery. The camera was enabled with freeware that allowed for it to take photos at 5 second intervals for around 30 minutes. 


Figure 1. The balloon was filled with helium from the large compressed tank on the right. The balloon nozzle was then secured using a metal staple to avoid any loss of helium. 

Figure 2. The camera was attached to the balloon cable via gimbal stabilizer. Even under windy conditions, the camera will stay pointing at the ground.

With the camera recording and the balloon high in the sky, the class set out to collect the aerial imagery. The class walked around the border of the park and through the center in order to collect the most ground imagery. The wind was quite strong so overlapping our route was necessary to make sure we had covered all portions of the soccer park. The hundreds of images were then mosiacked into a single aerial image seen below. This process was done using PhotoScan and Geosetter software. 

Figure 3. The mosiacked image completed using PhotoScan and Geosetter. 
The second method of UAS data collection we exercised was a second attempt at the rocket launch. The rockets were once again equipped with small video cameras that recorded the launch. The first rocket launch wasn't a complete success, as the fins detached immediately and the chute did not deploy. This caused the rocket to crash back down onto the pavement of the parking lot. 


Due to the high failure rate of our class's rocket launches, a second rocket was brought just in case. This was the first successful launch after 2 tries and featured a successful parachute deployment as well. The timing of the launch was precise enough to cause a flock of geese to change route while the rocket barreled towards them. 


The third and final mission completed at the soccer parks involved flying a designated route created using mission planning software for UAS. The route spanned across the entire soccer park in a snake pattern before returning to the home point next to the pavilion. 


Figure 4. The mission planning software displays route information on the right and the UAS perspective on the left. Altitude, UAS position, tilt and other information are all relayed in real time. 
Figure 5. Joe arming the unit in the distance. It is always important to stay a good distance away from the unit during launch and landing. 

Results 

The three missions completed during this exercise were successful. The balloon recording resulted in very accurate aerial imagery after the individual pieces were mosiacked together. This proved the balloon to be an effective method of aerial imagery collection as long as too much wind isn't present (in that case, just use a kite instead!). The UAS mission planning software was very useful, as we could monitor different mission variables such as the altitude, position, and battery level during the flight process. The UAS proved to be an extremely reliable and quick method to collect data in any environment. 


Thursday, April 17, 2014

Exercise 9: Topcon Land Survey

Introduction

The purpose of this exercise is to familiarize ourselves with the Topcon Total Survey Station. The TSS is a very precise piece of surveying equipment capable of reproducing landscapes in digital format. Common uses for this type of surveying equipment includes: road construction, land surveying, and law enforcement mapping. The TSS will be used to capture the landscape within the green space at UWEC. Once the points have been collected using the TSS and the GMS-2 GPS unit, they will be imported into ArcMap and interpolated to show elevation change within the UWEC green space. 

Methods

The study area for this exercise is the green space north of the Davies Center at UWEC. This area offers a wide open space for data collection as well as elevation changes for the Little Niagara stream that passes through it. 


Figure 1. The perspective of the TSS at the study area. Notable features include a elevation decline from right to left with the Little Niagara Stream just out of sight on the far left side. 


The first step to operating the TSS is correctly setting the unit in place. The three legs must be planted into the ground and then calibrated using the various turn knobs located on the legs. With the legs secure, the water level on the unit can be used to fine tune the balance of the unit. Each of the three ends of the platform must be adjusted so that the level shows it is balanced. With the legs and platform ready, the TSS unit can then be placed on the platform and secured using a screw on the platform. After turning the unit on, it is essential to connect the GPS unit via Bluetooth. 

Before any data collection can begin, unit height, receiver height, and occupied point must be set. The unit height can be found by measuring the distance from the ground to the height line specified on the side of the unit (1.78m during our data collection). The receiver height can be found by reading the measurement on the receiver unit (2m during our data collection). In order to set the occupied point, we simply collected a point directly under the TSS using the GPS. With this point set as our occupied point, we can now begin to collect data for the environment around us. 

Our team contained four members, so we decided it would be best for one person to hold the receiver and move around the landscape, one person to use the TSS to scope onto the receiver, one person to operate the GPS device, and the final person to rotate between positions. The receiver took the raised prism and chose various locations in the green space while the TSS operator zeroed in on the exact center of the prism. Once the scope was centered on the prism, the operator would call "fire" and the GPS user would hit the collect point button. After a few seconds of data collection, the GPS unit would chime and tell us that the point was successfully collected. Once we heard this chime, we would shout to the receiver to inform them to move locations. This process was repeated until 100 points were taken in the green space.


Figure 2. The TSS operator aims the scope directly onto the receiver prism. Once in position, he tells the GPS operator to collect the point. 

Figure 3. The receiver holds the prism so that the TSS operator can aim into the center. The prism's bright orange sides make it easy to spot from a distance. 

Results

After importing the points into ArcMap, we than conducted spatial interpolation to get a better idea of the landscape of the green space. The occupied point is represented by the yellow point towards the right in both Figure 4 and Figure 5. 

Figure 4. The raw points as they were imported from the GPS unit.

Figure 5. Spatial interpolation by using the kriging method. The elevation decrease is quite obvious as well as the location of the stream in the dark green portions.

Discussion

Once the station was successfully set up, data collection was a breeze. Our group did however spend almost an hour trying to set the occupied point, which dragged the data collection on for much longer than it should have. We had a very limited time to learn how to operate the unit before data collection and the notes that were provided seemed unclear at times. 

Another problem during data collection was the Bluetooth connectivity of the GPS unit. Nearly every five minutes the unit would disconnect from the TSS and we would have to back out to the menu in order to reconnect it. This process wasted a lot of our collection time and caused us to be out in the cold for much longer than we had hoped for. 

The final issue we ran into was the data orientation. During the backsight setup, we accidentally set the back sight incorrectly by exactly 180 degrees, causing our data to be rotated 180 degrees as well. This issue was solved by locating the occupied point and rotating all the data around it. 


Sunday, April 13, 2014

Exercise 8: ArcPad Data Collection


Introduction

A microclimate is defined as a local atmospheric zone where the climate differs from the surrounding area. These climatic differences can be caused by both geomorphic and man-made features. In order to collect and display microclimate data, a mobile weather station and a GPS (preferably an ArcPad-enabled unit) is needed to collect weather recordings and combine the information with the correct spatial locations. Measurements such as temperature, relative humidity, dew point, wind speed, wind direction, and snow depth will be taken. These values will then be exported to ArcMap for interpolation and observed to identify the characteristics of UWEC's microclimate. 

Methods

The setup for this exercise can be found from this previous post. A geodatabase structured with domains is essential to collecting field data quickly and efficiently, especially when working with multiple formats of units. With the geodatabase exported onto the Trimble Juno GPS device, we could simply enter in each weather observation into the multiple fields for each point. Kestrel mobile weather stations were operated in order to collect the various weather observations. 


Trimble Juno GPS Unit
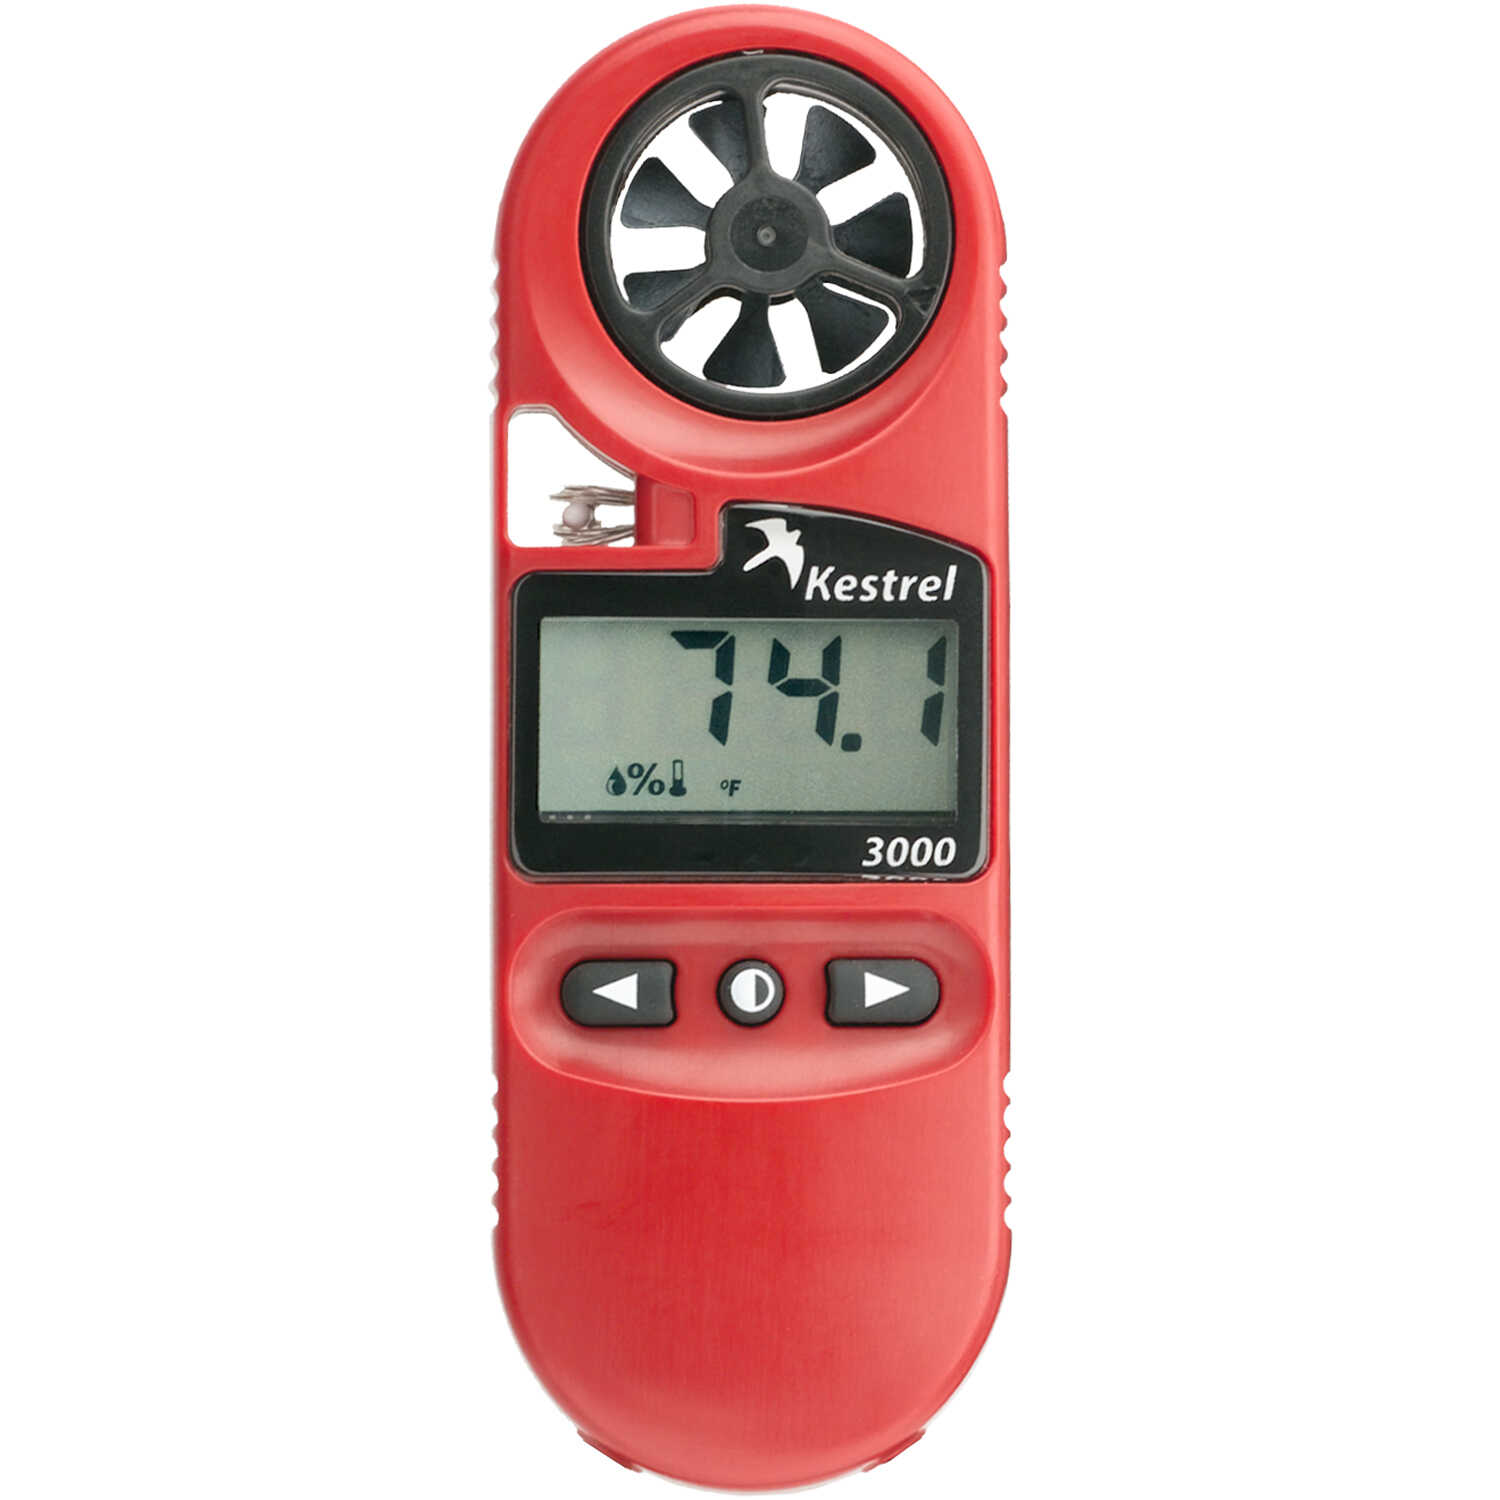
Kestrel Mobile Weather Station


The class was split into small teams that each covered a different part of campus before all of the data was exported and merged into one feature class. Data was then interpolated using various methods such as kriging, spline and inverse distance weighted (IDW). 

Results

The maps below display different atmospheric observations as they are interpolated across the campus of UWEC. The combination of steep elevation changes, the Chippewa River, and tall education buildings creates an interesting microclimate that alters atmospheric conditions across the landscape. 


Discussion

One minor issue with this exercise was that our background aerial imagery for the Juno unit did not work. We realized that instead of deploying the image as a background .TIFF file, we must have deployed it as a different format that was not readable by the unit. This problem did not hinder our results at all, as the image would have only helped us to avoid collecting measurements in locations we had already visited. 

Another minor issue with the class data was that one of the group's data points were located somewhere in South America. This problem must have happened during the data export process so the points in question were promptly removed.