Introduction
A microclimate is defined as a local atmospheric zone where the climate differs from the surrounding area. These climatic differences can be caused by both geomorphic and man-made features. In order to collect and display microclimate data, a mobile weather station and a GPS (preferably an ArcPad-enabled unit) is needed to collect weather recordings and combine the information with the correct spatial locations. Measurements such as temperature, relative humidity, dew point, wind speed, wind direction, and snow depth will be taken. These values will then be exported to ArcMap for interpolation and observed to identify the characteristics of UWEC's microclimate.
Methods
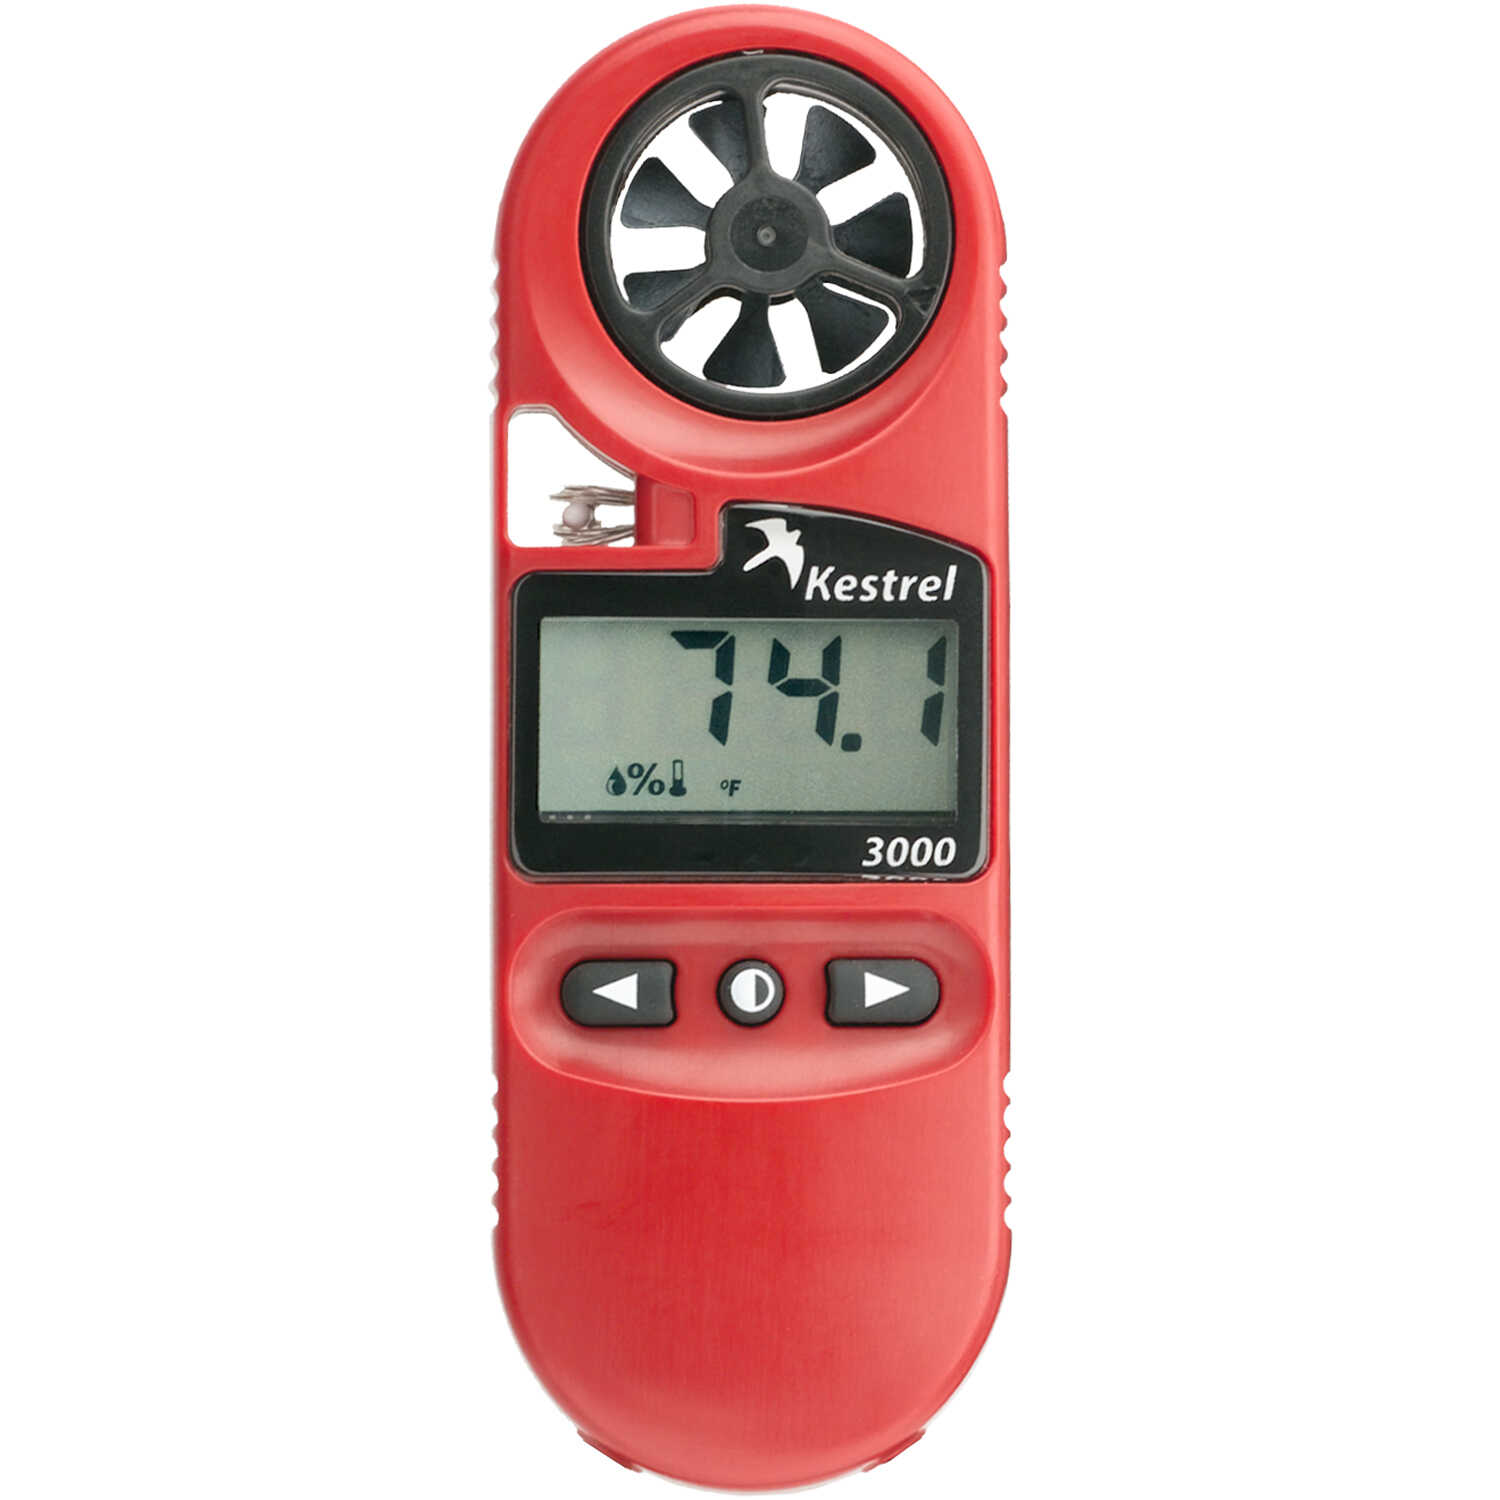
The setup for this exercise can be found from this previous post. A geodatabase structured with domains is essential to collecting field data quickly and efficiently, especially when working with multiple formats of units. With the geodatabase exported onto the Trimble Juno GPS device, we could simply enter in each weather observation into the multiple fields for each point. Kestrel mobile weather stations were operated in order to collect the various weather observations.
 |
| Trimble Juno GPS Unit |
 |
| Kestrel Mobile Weather Station |
The class was split into small teams that each covered a different part of campus before all of the data was exported and merged into one feature class. Data was then interpolated using various methods such as kriging, spline and inverse distance weighted (IDW).
Results
The maps below display different atmospheric observations as they are interpolated across the campus of UWEC. The combination of steep elevation changes, the Chippewa River, and tall education buildings creates an interesting microclimate that alters atmospheric conditions across the landscape.
Discussion
One minor issue with this exercise was that our background aerial imagery for the Juno unit did not work. We realized that instead of deploying the image as a background .TIFF file, we must have deployed it as a different format that was not readable by the unit. This problem did not hinder our results at all, as the image would have only helped us to avoid collecting measurements in locations we had already visited.
Another minor issue with the class data was that one of the group's data points were located somewhere in South America. This problem must have happened during the data export process so the points in question were promptly removed.


No comments:
Post a Comment