Wednesday, May 7, 2014

Exercise 12: GPS Navigation

Introduction

The previous exercise involved navigating to 5 points at the Priory using a map and compass. This week's exercise challenged each team to complete the entire course of 15 points with two added elements: a GPS unit and paintball rifles. ArcPad enabled GPS units were used to deploy the navigation map and course points created in ArcMap. Aside from the designated starting point for each team, the points could be visited in any order as long as the no shooting zones next to buildings were avoided. 

Methods

For this exercise, each team was given a different starting point in order to avoid firefights close to the no shooting zones. With our starting point located in the woods to the northwest of the priory campus, we decided to work our way through the points in a clockwise direction. 

Figure 1. The navigation map that was created in ArcMap and deployed onto the ArcPad enabled Juno GPS unit.


Using ArcMap, the map document was deployed onto the Juno unit by using the ArcPad Manager toolset. The map document was exported in a file type that was compatible with the unit and was placed on the SD card within the unit. 
Figure 2. The navigation map after it was deployed onto the Juno 3B unit. The large cluttered labels made it difficult to see our location which made navigation a difficult task. 
Results

Although pictures would have been great for this blog post, carrying a camera or smartphone was not considered a priority while engaging in firefights and dodging incoming fire. Due to the cluttered labels on the map and the spotty signals from within the forest, the GPS was essentially useless for navigation. The location marker on the unit was always changing directions and locations which made it extremely difficult to narrow down our current location let alone travel to the next point. It was at this point that we decided to solely rely on the map we printed, as the terrain on the map was recognizable from the ground for the most part. Somehow, we made it to 12 of the 15 points and encountered a few enemy teams along the way. We quickly realized that we were fighting the same group multiple times due to their similar route, and we decided upon a truce for the remainder of the exercise. 

When we attempted to zoom in and zoom out with the map, the ArcPad application would occasionally freeze and we would have to reset the whole unit. Each time we reset the unit, we noticed that the calibration decreased and decreased until the touch screen recognized the touch more than an inch away from the pen. Due to this problem, we were unable to plot any points at each of the flags let alone navigate using the GPS. A tracklog was also turned on before each group set off and unfortunately the data didn't record for any of the 6 groups.  

Discussion

Due to the many problems we encountered with the map document, the GPS signal, and the GPS touch screen, it is hard to say what could have been improved. Some factors were within our control while others were unsolvable and unforeseeable. The paintball factor added in a lot of stress when deciding routes, and it obviously made an impact on the team's decision making and morale. 


Friday, May 2, 2014

Exercise 11: Map and Compass Navigation

Introduction

The step up for this blog can be found in this earlier post. This exercise took us to the Priory, a university owned property with dense woods and steep ravines. The class was split into teams of 3 and sent out to navigate through one of three different courses on the property using only a map and compass. In areas of dense forest GPS signals can become weak and inaccurate, and this exercise taught us a valuable lesson that traditional navigation techniques are simple to learn, extremely accurate and very cost effective. 

Methods

Once our group assembled at the Priory, the first step was to receive the coordinates for the course points and plot them on the printed maps we created. Emily's map was used since it was the simplest design and was easy on the eyes. She also used the 5m contours which were a lot less cluttered than the 2 foot contours I had used. These points were represented by blaze orange flags hung onto trees, containing a hole puncher to prove our visit. With the five course points plotted directly on the map, we could then draw lines between each point using a straightedge in the correct order for measuring azimuth. We placed the center of the compass dial on the starting point, aligned the compass meridians with map north, and recorded the azimuth we would need to head towards to travel to each point. 


Figure 1. A compass and straightedge are necessary to accurately plot the route on a map. 

To properly navigate this course with the resources given to us, it was essential that each team member executed their role flawlessly. I was given the "runner" position which meant I would head off in the direction of travel until I was barely visible. The other team members would shout at me and tell me to move right or left in order to stay exactly on the line of travel. The next team member was the "counter", and would count the number of paces it took to travel from the starting point to me. The last team member who held the compass would then travel to us once the counting was completed and we would repeat the process until we reached the flag. Sometimes we would travel the correct distance and wouldn't arrive at a flag, so a marker like a backpack was left on the end point and we would spread out to find the flag. If we found out that we had traveled the route wrong, we would return to the backpack and adjust the route accordingly. 
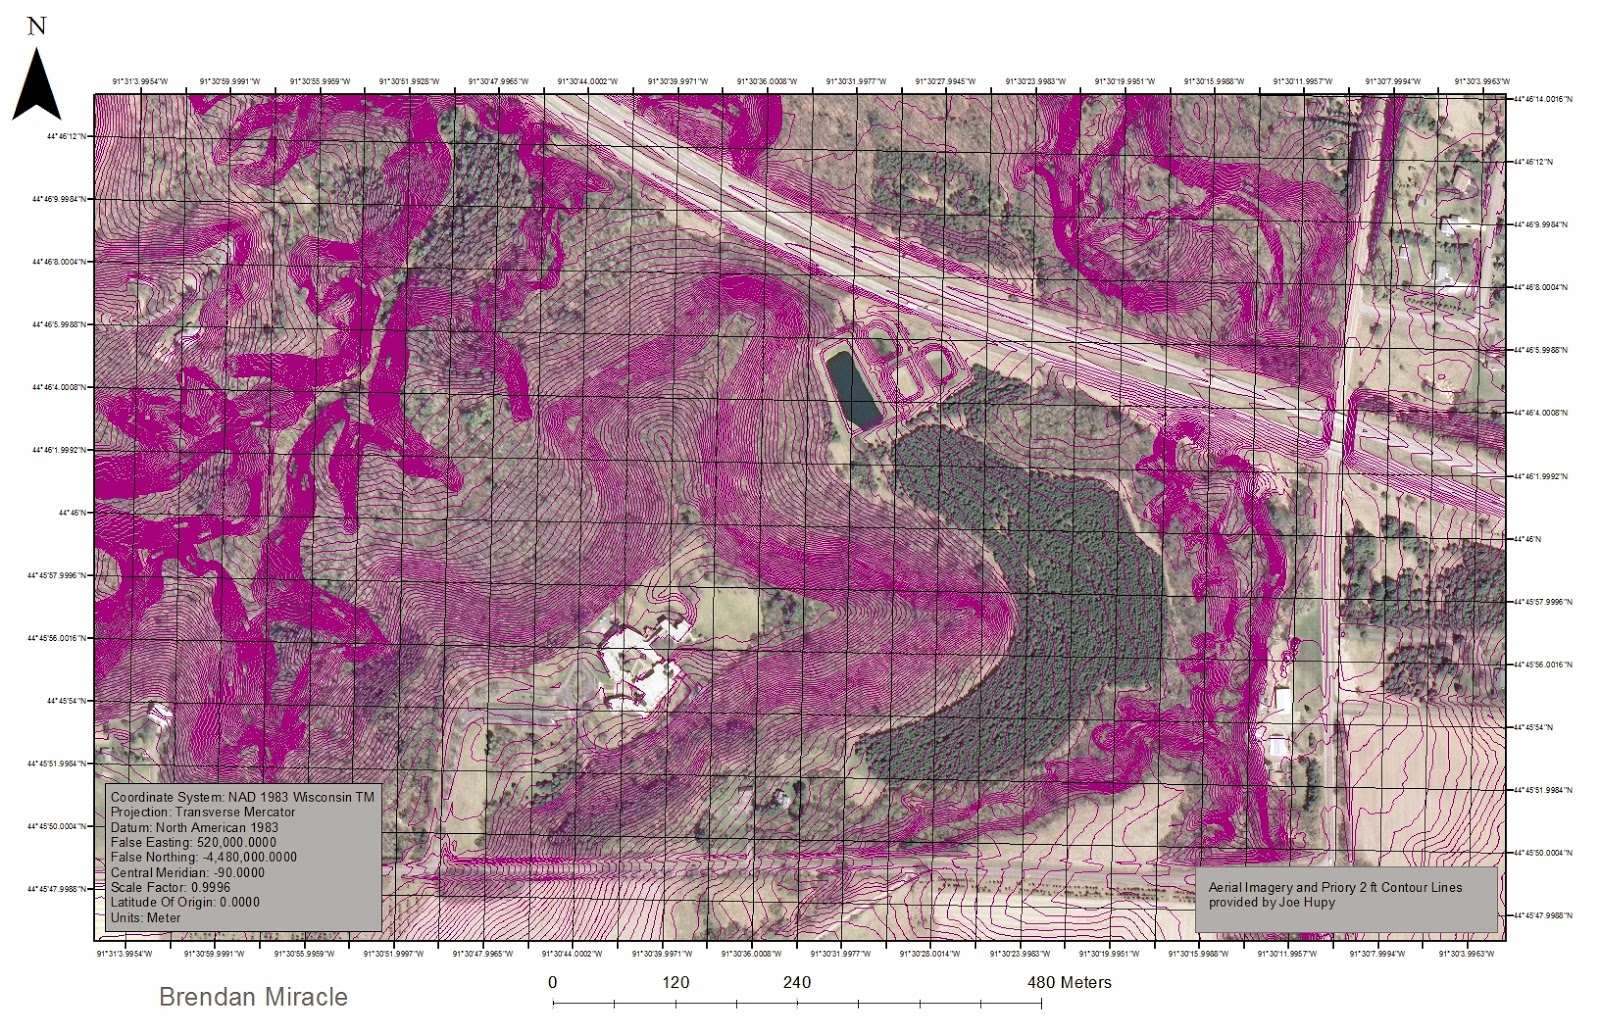
Results

The navigation exercise was a success and at the end of the day, we made it to each point and safely back to the starting location. The third point that we traveled to was accidentally plotted in the wrong location by me, and resulted in us being about 200 meters off course. Luckily we included the aerial imagery on the map, and we were able to find a landmark to use as a temporary starting point while we navigated to the third point using a new azimuth measurement. Since the grid was quite large on the map, it was difficult to plot the points exactly where they should have been, but once we got to the plotted area the flag was bright enough to be seen from about 100 meters away. 

Discussion

Some small changes I think could have been made to our methods involve the map construction. The font of the UTM coordinates were very light and hard to see against the light blue backdrop of the map. Also, additional ticks in the grid would have been nice considering how accurate our points had to be in order to complete the exercise. 

Sunday, April 27, 2014

Exercise 10: Unmanned Aerial Systems

Introduction

With the introduction of Unmanned Aerial Systems, the geospatial field has exploded into endless opportunities for data collection methods. The following exercise includes multiple occasions of UAS operation and the different type of data and aerial imagery that can be collected with them. Different UAS devices are more suitable for different environments and weather conditions, and this exercise is an attempt to familiarize ourselves with the various techniques used for collected geospatial data using a variety of UAS devices. 

Methods

The study area for these exercises was the soccer park south of Clairemont Ave. This area provided a large open space that minimized the chance of something going wrong during the UAS missions. 

The first mission we completed involved sending a large balloon hundreds of feet into the air and attaching a digital camera in order to collect aerial imagery. The camera was enabled with freeware that allowed for it to take photos at 5 second intervals for around 30 minutes. 


Figure 1. The balloon was filled with helium from the large compressed tank on the right. The balloon nozzle was then secured using a metal staple to avoid any loss of helium. 

Figure 2. The camera was attached to the balloon cable via gimbal stabilizer. Even under windy conditions, the camera will stay pointing at the ground.

With the camera recording and the balloon high in the sky, the class set out to collect the aerial imagery. The class walked around the border of the park and through the center in order to collect the most ground imagery. The wind was quite strong so overlapping our route was necessary to make sure we had covered all portions of the soccer park. The hundreds of images were then mosiacked into a single aerial image seen below. This process was done using PhotoScan and Geosetter software. 

Figure 3. The mosiacked image completed using PhotoScan and Geosetter. 
The second method of UAS data collection we exercised was a second attempt at the rocket launch. The rockets were once again equipped with small video cameras that recorded the launch. The first rocket launch wasn't a complete success, as the fins detached immediately and the chute did not deploy. This caused the rocket to crash back down onto the pavement of the parking lot. 


Due to the high failure rate of our class's rocket launches, a second rocket was brought just in case. This was the first successful launch after 2 tries and featured a successful parachute deployment as well. The timing of the launch was precise enough to cause a flock of geese to change route while the rocket barreled towards them. 


The third and final mission completed at the soccer parks involved flying a designated route created using mission planning software for UAS. The route spanned across the entire soccer park in a snake pattern before returning to the home point next to the pavilion. 


Figure 4. The mission planning software displays route information on the right and the UAS perspective on the left. Altitude, UAS position, tilt and other information are all relayed in real time. 
Figure 5. Joe arming the unit in the distance. It is always important to stay a good distance away from the unit during launch and landing. 

Results 

The three missions completed during this exercise were successful. The balloon recording resulted in very accurate aerial imagery after the individual pieces were mosiacked together. This proved the balloon to be an effective method of aerial imagery collection as long as too much wind isn't present (in that case, just use a kite instead!). The UAS mission planning software was very useful, as we could monitor different mission variables such as the altitude, position, and battery level during the flight process. The UAS proved to be an extremely reliable and quick method to collect data in any environment. 


Thursday, April 17, 2014

Exercise 9: Topcon Land Survey

Introduction

The purpose of this exercise is to familiarize ourselves with the Topcon Total Survey Station. The TSS is a very precise piece of surveying equipment capable of reproducing landscapes in digital format. Common uses for this type of surveying equipment includes: road construction, land surveying, and law enforcement mapping. The TSS will be used to capture the landscape within the green space at UWEC. Once the points have been collected using the TSS and the GMS-2 GPS unit, they will be imported into ArcMap and interpolated to show elevation change within the UWEC green space. 

Methods

The study area for this exercise is the green space north of the Davies Center at UWEC. This area offers a wide open space for data collection as well as elevation changes for the Little Niagara stream that passes through it. 


Figure 1. The perspective of the TSS at the study area. Notable features include a elevation decline from right to left with the Little Niagara Stream just out of sight on the far left side. 


The first step to operating the TSS is correctly setting the unit in place. The three legs must be planted into the ground and then calibrated using the various turn knobs located on the legs. With the legs secure, the water level on the unit can be used to fine tune the balance of the unit. Each of the three ends of the platform must be adjusted so that the level shows it is balanced. With the legs and platform ready, the TSS unit can then be placed on the platform and secured using a screw on the platform. After turning the unit on, it is essential to connect the GPS unit via Bluetooth. 

Before any data collection can begin, unit height, receiver height, and occupied point must be set. The unit height can be found by measuring the distance from the ground to the height line specified on the side of the unit (1.78m during our data collection). The receiver height can be found by reading the measurement on the receiver unit (2m during our data collection). In order to set the occupied point, we simply collected a point directly under the TSS using the GPS. With this point set as our occupied point, we can now begin to collect data for the environment around us. 

Our team contained four members, so we decided it would be best for one person to hold the receiver and move around the landscape, one person to use the TSS to scope onto the receiver, one person to operate the GPS device, and the final person to rotate between positions. The receiver took the raised prism and chose various locations in the green space while the TSS operator zeroed in on the exact center of the prism. Once the scope was centered on the prism, the operator would call "fire" and the GPS user would hit the collect point button. After a few seconds of data collection, the GPS unit would chime and tell us that the point was successfully collected. Once we heard this chime, we would shout to the receiver to inform them to move locations. This process was repeated until 100 points were taken in the green space.


Figure 2. The TSS operator aims the scope directly onto the receiver prism. Once in position, he tells the GPS operator to collect the point. 

Figure 3. The receiver holds the prism so that the TSS operator can aim into the center. The prism's bright orange sides make it easy to spot from a distance. 

Results

After importing the points into ArcMap, we than conducted spatial interpolation to get a better idea of the landscape of the green space. The occupied point is represented by the yellow point towards the right in both Figure 4 and Figure 5. 

Figure 4. The raw points as they were imported from the GPS unit.

Figure 5. Spatial interpolation by using the kriging method. The elevation decrease is quite obvious as well as the location of the stream in the dark green portions.

Discussion

Once the station was successfully set up, data collection was a breeze. Our group did however spend almost an hour trying to set the occupied point, which dragged the data collection on for much longer than it should have. We had a very limited time to learn how to operate the unit before data collection and the notes that were provided seemed unclear at times. 

Another problem during data collection was the Bluetooth connectivity of the GPS unit. Nearly every five minutes the unit would disconnect from the TSS and we would have to back out to the menu in order to reconnect it. This process wasted a lot of our collection time and caused us to be out in the cold for much longer than we had hoped for. 

The final issue we ran into was the data orientation. During the backsight setup, we accidentally set the back sight incorrectly by exactly 180 degrees, causing our data to be rotated 180 degrees as well. This issue was solved by locating the occupied point and rotating all the data around it. 


Sunday, April 13, 2014

Exercise 8: ArcPad Data Collection


Introduction

A microclimate is defined as a local atmospheric zone where the climate differs from the surrounding area. These climatic differences can be caused by both geomorphic and man-made features. In order to collect and display microclimate data, a mobile weather station and a GPS (preferably an ArcPad-enabled unit) is needed to collect weather recordings and combine the information with the correct spatial locations. Measurements such as temperature, relative humidity, dew point, wind speed, wind direction, and snow depth will be taken. These values will then be exported to ArcMap for interpolation and observed to identify the characteristics of UWEC's microclimate. 

Methods

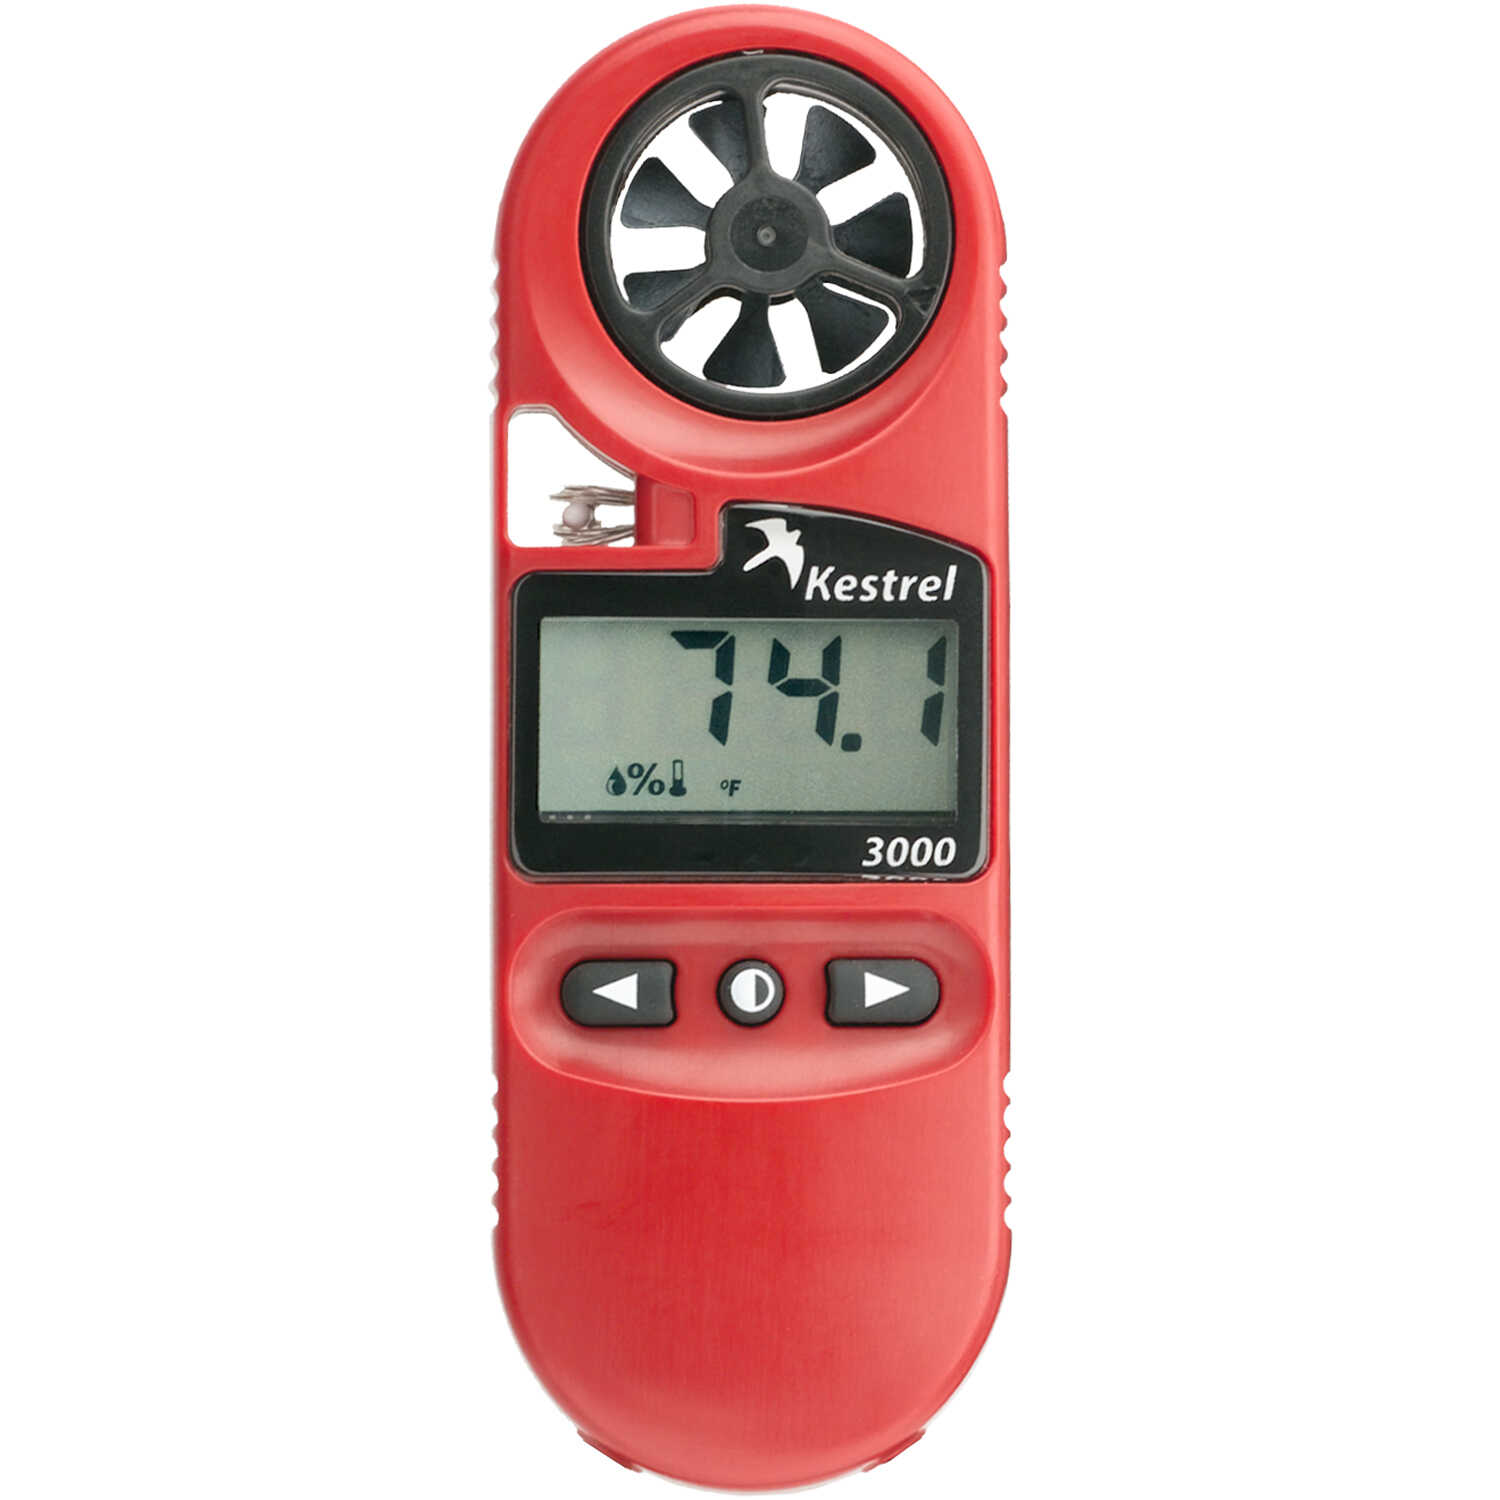
The setup for this exercise can be found from this previous post. A geodatabase structured with domains is essential to collecting field data quickly and efficiently, especially when working with multiple formats of units. With the geodatabase exported onto the Trimble Juno GPS device, we could simply enter in each weather observation into the multiple fields for each point. Kestrel mobile weather stations were operated in order to collect the various weather observations. 


Trimble Juno GPS Unit
Kestrel Mobile Weather Station


The class was split into small teams that each covered a different part of campus before all of the data was exported and merged into one feature class. Data was then interpolated using various methods such as kriging, spline and inverse distance weighted (IDW). 

Results

The maps below display different atmospheric observations as they are interpolated across the campus of UWEC. The combination of steep elevation changes, the Chippewa River, and tall education buildings creates an interesting microclimate that alters atmospheric conditions across the landscape. 


Discussion

One minor issue with this exercise was that our background aerial imagery for the Juno unit did not work. We realized that instead of deploying the image as a background .TIFF file, we must have deployed it as a different format that was not readable by the unit. This problem did not hinder our results at all, as the image would have only helped us to avoid collecting measurements in locations we had already visited. 

Another minor issue with the class data was that one of the group's data points were located somewhere in South America. This problem must have happened during the data export process so the points in question were promptly removed. 


Wednesday, March 12, 2014

Exercise 7: Introduction to Unmanned Aerial Systems

For this week's exercise we assembled out in the field to experience unmanned aerial systems up close and personal. Joe Hupy and Max demonstrated how to operate the controls of the UAS units and the differences between the two builds. Max's rotary unit had 6 arms with a propeller on each, while Joe's rotary unit had 3 arms with 2 propellers on each (Figure 1.). Both units had a similar maximum speed and a flight duration of 15 minutes. The two units had exceptional agility while performing high speed maneuvers and great stability when hovering (Figure 2.). Joe's unit was equipped with a digital camera attached to a gimbal stabilizer. This allowed the camera to stay level no matter the orientation of the UAS. This function is highly useful for windy conditions that would usually alter the alignment and angle of the camera.

Figure 1. Max's 6 armed UAS on the left and Joe's 3 armed UAS on the right. Each unit has 6 propellers and a flight time of 15 minutes. 


Figure 2. Max flying his unit a foot above the surface. Rotary wing units are extremely agile and stable.
The next unit in the demonstration was a high altitude kite (Figure 3.). The kite is useful for windy conditions that a UAS vehicle or a balloon would not be able to handle. By attaching a digital camera to the kite string via gimbal, aerial images can be collected with ease. The camera was set to take a picture every second for 2 minutes, providing the operator with plenty of time to get the kite to the desired altitude for data collection. Altitude of the imagery can be altered by simply raising or lowering the kite, and shifting the imagery to the side only requires the kite controller to walk to the desired location. These kites can collect data from hundreds of feet in the air and only require a bit of wind to operate (Figure 4.)

Figure 3. This high altitude kite is very affordable and perfect for collecting data on a windy day. 

Figure 4. The kite was equipped with a hanging digital camera to take aerial images during the flight. 
The grand finale of the demonstration included a rocket launch. Two small video cameras the size of key-chains were attached to the rocket via tape to record both the ascend and descend of the rocket (Figure 5.). Unfortunately, upon launch the rocket engines were loaded in improperly and caused the rocket to only fly about 100 feet upwards. A successful launch should have yielded altitudes of 3 to 4 times greater than our results, but we will have to wait for better weather to schedule a relaunch. 


Figure 5. Joe attaching the small video cameras to the fuselage of the rocket. Had the launch gone according to plan, two different angles of the ascend and descend would have been recorded. 

This demonstration of various UAS data collection techniques displayed the huge potential within this field. Using UAS to collect data is far cheaper, faster, simpler, and much more efficient for today's purposes. I am truly excited to work in such a new field and contribute to the growing success of unmanned aerial systems. 

Sunday, March 9, 2014

Exercise 6: Creating a Geodatabase

Why use Geodatabases and Domains?

GIS professionals use a lot of data that is typically stored in multiple sets of files. By using a geodatabase to store these files, they seamlessly share the same properties such as coordinate system, projection, and map units.  Domains help GIS professionals collect data quickly and efficiently without altering the data with human error. By setting up this infrastructure before the data is collected, much time can be saved both out in the field and afterwards in the lab when the data would need to be organized for analysis. 

In the near future, an exercise involving a microclimate map for the University of Wisconsin-Eau Claire will be conducted. Until the weather becomes more inviting, the most we can do is prepare a geodatabase and create specific domains to assist us during data collection and analysis. Variables we will be collecting include temperature, wind speed and direction, snow depth, dew point, and humidity. Each of these variables are recorded and formatted in different methods which means that domains will be need to be used to keep the values orderly. Temperature and dew point are recorded in integers, and it is safe to assume that the temperature on a given day will fall somewhere between -20 degrees Fahrenheit and 99 degrees Fahrenheit. In this case, a Float-Range domain will be created to only accept temperature values within the provided ranges. Wind direction can be collected in two formats, cardinal directions and azimuth bearing. When collecting the cardinal directions, a Text-Coded Values domain will be used to translate N to North, NW to Northwest, etc. Bearing azimuth is collected in degrees ranging from 0 to 360, and will utilizing a similar domain to that of temperature. Snow depth and humidity will be collected in amounts that could require decimal places, which makes Float the proper domain of choice. By creating a feature class utilizing these domains, data collection will be swift and unbiased by human error. 

Tutorial

This tutorial will explain how to create a geodatabase, create domains, and apply them to a new feature class within ArcMap 10.2.

A geodatabase is a collection of geographic datasets of various types, including feature classes, feature datasets, raster datasets, network datasets, tables, and more. The first step of creating a geodatabase within ArcMap 10.2 is to connect to the folder in which the new geodatabase will be located. Once the desired location is found, simply right click the folder and select New-File Geodatabase (Figure 1.). 


Figure 1. Many options regarding the geodatabase appear when the cursor right clicks the icon. 


Domains are rules that describe the legal values of a field type, providing a method for enforcing data integrity. For the purposes of this exercise, we are going to set domains that will help us collect accurate weather recordings for a microclimate map. To create a domain, right click the geodatabase and select Properties at the bottom of the drop down menu, and select the Domains tab inside the Geodatabase Properties window (Figure 2.). The top of the window shows two columns, one titled Domain Name and one titled Description. To create a domain, simply type a fitting name into the Domain Name column. A description is not necessary, it is only there to help you remember what the domain is to be used for. 

Figure 2. By opening the Properties of a geodatabase, the domains can be created and edited.


The first domain we will create for this exercise is one regarding rules for temperature values. The Temperature domain will be set to the Float field type because our temperature readings may contain decimals. By setting the domain type to Range, we can choose minimum and maximum values to set boundaries on our data. Taking dew point measurements into account, the minimum temperature value will be -20 degrees Fahrenheit and the maximum value will be 99 degrees (Figure 3.). This domain will be applied for both surface air temperature recordings and dew point temperature recordings. 


Figure 3. This domain will regulate values that represent temperature recordings. 


Another important domain needed to be created is one regarding time data. The time of each feature point will be recorded in a field titled Time. This field will require a domain that limits input values to the extent of military time. With the minimum value set to 0 and the maximum value set to 2400, an integer field type such as Short or Long can be used to allow whole numbers only (Figure 4.).


Figure 4. Integer field types are great for measurements with no fractions or decimals like time. 


Another domain we will use for the microclimate data collection will apply to wind direction data. This domain will have a Text field type and a Coded Values domain type. The use of coded values will allow us to simply type "NW" and the domain will recognize it as "Northwest". To create these associations, type a short code into the Code column and type the corresponding description in the Description column (Figure 5.). 

Figure 5. Coded values allow for quick and accurate data entry out in the field while minimizing human error. 


Once all of the desired domains have been created, simply press OK to close the window. In order to create a feature class, right click on the geodatabase that was created earlier and select New-Feature Class... (Figure 6.). For the microclimate exercise, we will be plotting individual points, causing Point Feature Class to be the desired feature class type. Near the end of the wizard, a window displaying field names and data types will be used to create fields and apply the domains we created earlier. I have created a field called Temperature and set the data type to Float. At the bottom of the window, a drop down menu reveals the domains that apply to float data types (Figure 7.). Simply select the corresponding domain and the newly created field will follow the rules set within the domain. 


Figure 6. Creating a new feature class from scratch allows the user to set specified domains and subtypes. 


Figure 7. Domains will not be applied to fields unless they are chosen within the drop down menu shown above. 


The final step of this tutorial explains how to import a raster into a geodatabase. Right click the geodatabase and select Import-Raster Datasets...(Figure 8.). A file explorer will appear and allow you to locate the desired raster. 


Figure 8. By right clicking the geodatabase icon, feature classes, tables, and rasters can be imported. 

Tuesday, March 4, 2014

Exercise 5: Orienteering Preparation

Introduction

Continuing the trend of "old-school" field methods from last week, this week we took a look at the basics of orienteering using only a map and a compass. These skills are the foundation of any type of physical geography techniques and are extremely helpful when modern technology cannot be used. Al Wiberg from the Environmental Adventure Center at UWEC visited our lab to give us a workshop on the basics of orienteering. The goal of the workshop was to prepare us for a future class activity in which we will be navigating to various points at the Priory, an annexed housing property of UWEC. The study area contains rough terrain and many obstacles, making learning the basic skills of orienteering extremely important. The first portion of this exercise included finding our pace count, learning how to operate a compass, and creating a topographic map in order to navigate the course at the Priory.
 

Methods


Pace Count

In order to find your pace count, you simply walk straight for 100 meters, keeping every stride consistent in length. This pace should be comfortable and repeatable in the field in order to measure distance accurately. While walking the 100 meter distance, count each step with the same foot, not both feet. For example, I only counted the steps with my left foot and I counted a total of 66 strides for the 100 meter distance. Most pace counts are found in the mid to high 60's, with taller people needing less paces and shorter people needing more.  It is recommended to measure your pace count multiple times in order to acquire the most accurate rate. This pace count will be used in the field in conjunction with the map scale bar in order to keep track of the distance traveled, which is crucial information while traversing through terrain with only a map and compass. Al taught us to hold a small twig and break off a piece each time you reached 100 meters according to your pace count. If there is ever confusion about how far you traveled, simply count the pieces of twig that you have in your pocket and the distance can be estimated from there. 


Compass Basics

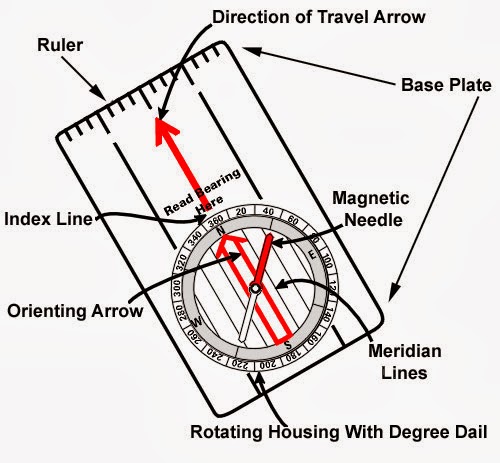
Once the pace count was calculated, the next step was to learn how to navigate with one of our resources, the compass. The terms used in the following instructions can be found on Figure 1. The first step in using a compass for navigation is understanding the starting point and the destination. It is useful to draw a line using the straightedge of the compass to connect the two locations. Once the line is drawn, place the center of the dial on top of the starting point and rotate the entire device so that the direction of travel arrow faces the destination and sits directly on top of the drawn line. Next, rotate the rotating housing to face true north. Meridian lines on the housing and the map grid should help to align the orienting arrow to face North (at this point magnetic declination should be taken into account, but to due Eau Claire's location declination isn't a significant issue). Examine the azimuth degree values along the rotating housing and find the value that lines up with the direction of travel arrow. This will give you the azimuth bearing to your destination. To navigate from the starting point to the destination, simply keep the magnetic needle inside the orienting arrow (red shed) and begin walking in the direction of travel. 

Figure 1. A compass has many measurements and components to help travelers navigate to their destination with ease.


Map with Grid System

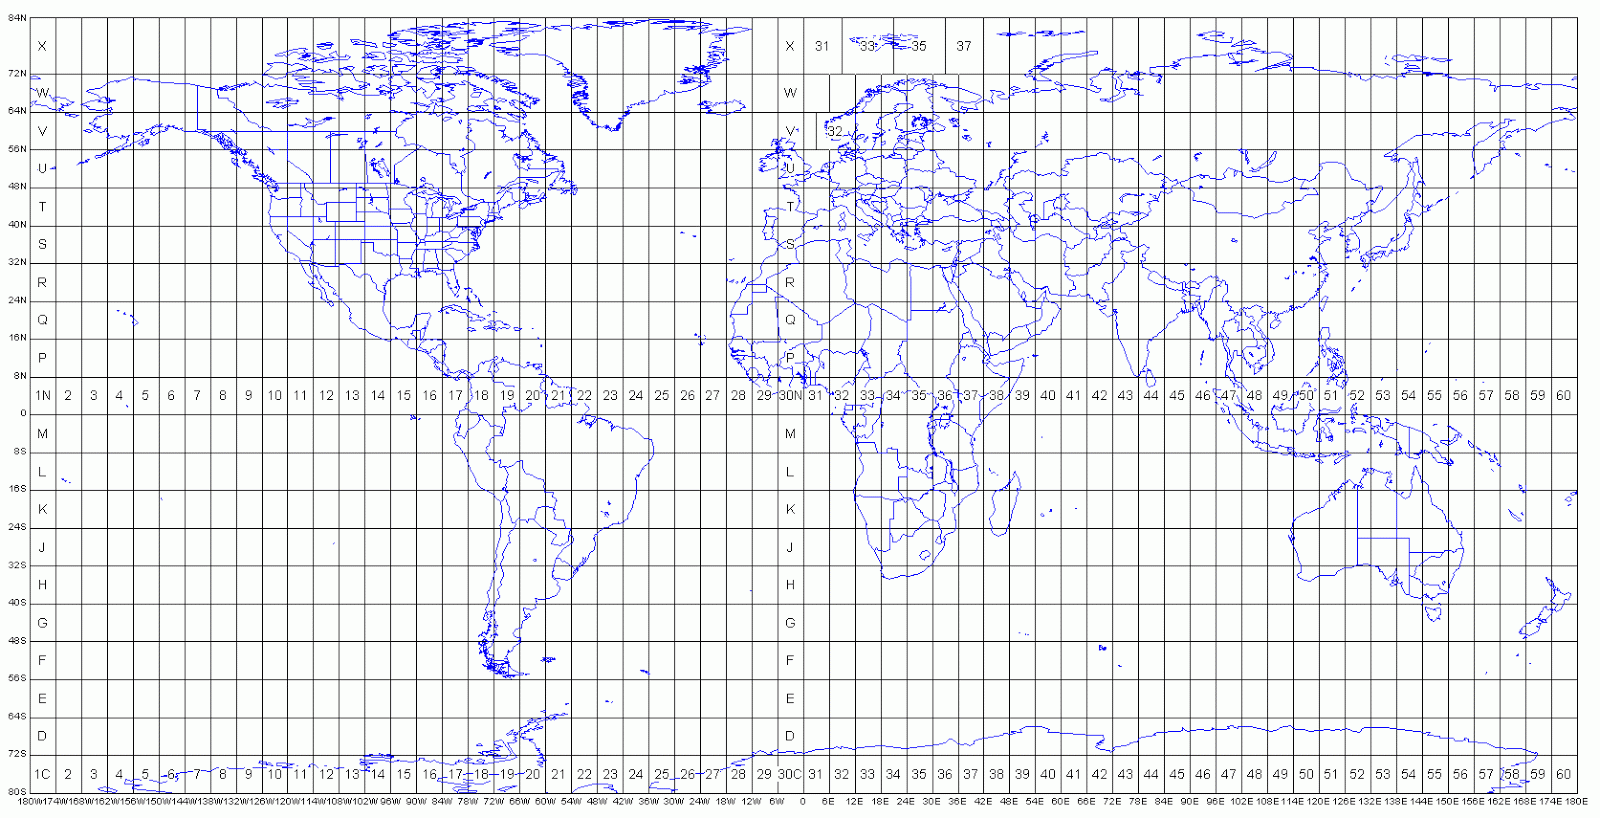
To properly navigate the terrain, a map is the second resource we will be using in the field. It is important that the map includes the entire study area but also includes enough detail at the same time. Since most of the landscape looks like a forest, it is important to include elevation contour lines in order to find the differences in the terrain while we are on the ground. Once the contour lines were placed on top of an aerial image of the study area, the final component to include were the grid lines. Two maps were created for the exercise, one map measuring location using the Universal Transverse Mercator (UTM) System, and the other using decimal degrees. The UTM system uses a 2-dimensional coordinate system to give locations on the surface of the Earth according to meridians created by 60 zones around the planet (Figure 2.). Decimal degrees express latitude and longitude as decimal fractions instead of degrees, minutes, and seconds. Positive latitudes are north of the equator while positive longitudes are east of the Prime Meridian (Figure 3.). 

Figure 2. The planet is divided into 60 vertical zones within the UTM system. Eau Claire is located in the northern section of UTM zone 15. 

Figure 3. In the decimal degrees system, coordinates are written as decimal values instead of using degrees, minutes, and seconds. The decimal degree location of Eau Claire is (44.8167 N, 91.5000 W).

Results

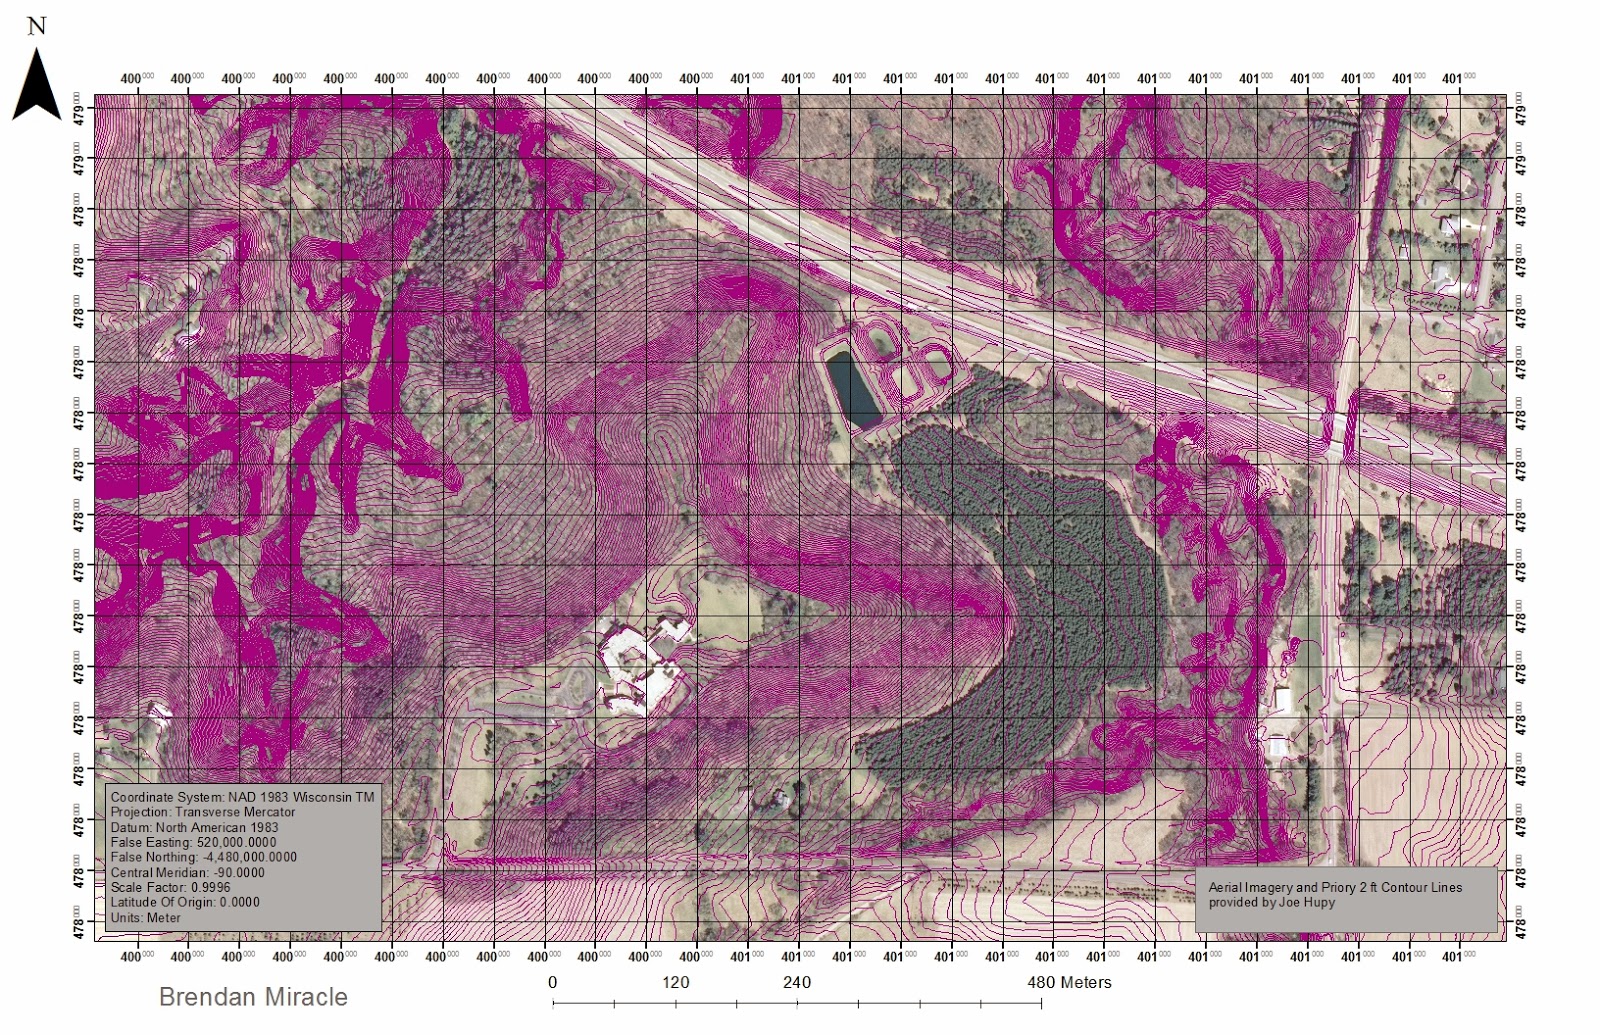
The maps created for the navigational exercise look identical besides the grid system that is being placed above the surface data. Figure 4 is the map containing the UTM grid and Figure 5 contains the decimal degrees system. The 2 foot contour lines were colored bright pink in order to distinguish them from the dark basemap and grid lines. 

Figure 4. This map displays the Priory area with 2 foot contour lines under a UTM grid.

Figure 5. This map displays the Priory area with 2 foot contour lines under a decimal degrees grid. 

Sunday, February 23, 2014

Exercise 4: Distance Azimuth


Introduction


In the past few decades, new technologies such as satellites and GPS units have changed the way that geographical measurements and surveys have been taken. These technologies are crucial to many parts of our everyday lives, such as traveling to a new destination and relying on a smart phone for directions.  Although these technologies have changed the way that the modern world runs, they are simply electronics that can be unreliable and troublesome. Because of this fact, this exercise involves locating features using field methods that have been utilized for centuries. As long as the exact location of a reference point is known, accurate locations of features can be calculated using only simple distance and directional bearing measurements. This exercise incorporates old world measuring techniques with new world mapping technology to accurately locate features.


Methods


The first task in this exercise was locating a study area. An ideal location for this exercise needed to contain at least 100 unique features that could be measured for distance and azimuth. The first location that we came up with was a park since they contain many trees, light poles, benches, tables, and other features. It was also important that this location was close to campus since the winter temperatures are extremely cold in Eau Claire and we did not necessarily want to be outside for longer than we needed to be. We decided upon Randall Park (Figure 1) within the student housing area of Eau Claire. This park was a simple rectangle plot which made it very easy to decide on reference points for the measurements to be made. 


Figure 1. Randall Park is a rectangular city park located in the student housing area just north of the University of Wisconsin-Eau Claire. Close proximity to campus, many features and a simple shape made this park a great candidate for this survey.


Since this exercise involved directional bearing measurements, it is important to know the magnetic declination of the study area. Magnetic declination is the angle on the horizontal plane between magnetic north and true north. Magnetic north is the direction in which a compass points north, and true north is the direction along a meridian towards the North Pole. Magnetic declination is only about 1.07 degrees West in Eau Claire, which is insignificant due to the small scope of this exercise. This declination has such a small effect on the measurements that it is not necessary to calibrate the equipment before measuring azimuth. 


Figure 2. This figure displays the amounts of magnetic declination across the continental United States. Magnetic declination varies not only over distance but also time. The movement of the Earth's inner core causes the magnetic field to gradually shift positions and even completely reverse every several thousand years. 


In order to collect the data quickly and efficiently, we set up tables on notebook paper containing columns for feature numbers, coordinates, distance in meters, and azimuth in degrees. We also collected attribute data to distinguish each feature as a light pole or a bench or a tree, but later during the exercise we realized we could not use this data in such a way.

The instruments utilized in this exercise include a laser rangefinder and a two part radio rangefinder (Figure 3). A compass was also brought along for the azimuth measurements but the laser rangefinder proved to be much quicker and easier to use during data collection.


Figure 3. From left to right: laser rangefinder, compass, two part radio rangefinder. The compass collects azimuth measurements, the radio rangefinder collects distance measurements, and the laser rangefinder can collect both simultaneously.


Since our group consisted of only two members, we decided to have Nathan stand near each feature with the radio rangefinder receiver (Figure 4). Standing at the reference point, I would then activate the device and shout the measurements to Nathan who recorded the numbers in the table. Next, I viewed the location with the laser rangefinder in order to find the azimuth measurement and shouted those numbers back to him as well (Figure 5). To complete measurements for 100 features, we collected data from 3 different reference points in the park in a little over an hour's time. 

After the first few measurements, we realized that the two part radio rangefinder had a maximum range of about 40 meters, so the laser rangefinder was used for any distances which required it. 


Figure 4. Nathan holding the receiver of the two part radio rangefinder. This method was the most accurate but was only useful for measurements under 40 meters in distance.
Figure 5. Me using the laser rangefinder to collect data. This device allowed us to collect both distance and azimuth data quickly and efficiently.

All of the measurements were recorded into the notebook tables (Figure 6) before being entered into a digital spreadsheet (Figure 7). The information in the tables were recorded in separate columns so that ArcGIS software could seamlessly access the information. 


Figure 6. Each page contained data for a separate reference point so that the measurements didn't end up in an incorrect location.


Figure 7. This image displays a portion of the completed data table. The X and Y coordinate fields contain the locations of the three reference points, which were found in ArcMap after data collection.


With the spreadsheets completed and formatted correctly they were imported into a file geodatabase made specifically for this exercise. The data layer was immediately set to the WGS 1984 Geographic Coordinate System since the data was formatted for lat/long units. An aerial imagery basemap was added in order to properly visualize the measurements from the survey. 

The first tool that was used in this exercise was the Distance Bearing to Line tool. This tool creates line data based on distance, azimuth, and XY coordinates from the reference point (Figure 8), all found from within the imported table. The result is a series of lines originating from each reference point to the feature locations around them. The next tool used was Feature Vertices to Points, which simply placed a point at the end of each line created from the previous tool (Figure 9). Theoretically, these points should be placed at the exact location of each of the features that we surveyed. 


Figure 8. When finding magnetic bearing or azimuth, magnetic north is displayed as 0 degrees. The exact location of a feature can then be found by examining the distance and bearing from the reference point in relation to magnetic north. 


Figure 9. This aerial image shows the reference points and the corresponding feature locations from the survey. To accurately cover the most features, we divided the survey into three parts from three reference points. 


Discussion


A problem that we ran into during data collection was that the two part radio rangefinder did not operate correctly for any distances beyond 40 meters. This made data collection more difficult because it was very quick for us to have Nathan hold the receiver at each feature while I found the distance from the reference point. The radio rangefinders worked great even through thick brush, which was very common in the park between the features and reference points. Some features were too far for the radio rangefinders but too thin to target with the laser rangefinder, so Nathan would stand at the feature and I would measure him instead. Even this method proved difficult as the snow was 3 feet deep, making it challenging for Nathan to reach each feature. 

One point for this exercise that should be discussed is the importance of accuracy for the reference points. It was crucial to locate reference points that would be visible from aerial photographs. For this reason, we chose to use the intersections of the outer sidewalks as the reference points. After surveying from two of the corners of the park, we decided that we could collect the most features from the center of the park, and it would also be easy to locate the area in an aerial image as well. Once the data layer was set to the WGS 1984 Geographic Coordinate System, the reference points were placed and their locations were recorded to six decimal places. This accuracy was absolutely necessary because a simple difference of .1 decimal degrees meant a land difference of about 8 km. 

As visible from Figure 9, some of the feature locations reach out of the park and into the middle of Third Street. This occurrence can not be explained, but it may have to do with problems within the relationship of the basemap and the coordinate system. It was quite difficult to steady the laser rangefinder due to gusts of wind and shaking hands, and this fact may contribute to the inaccuracy of the feature locations as well. A solution to this problem would have been to utilize a tripod during data collection. 

The last problem we ran into during the analysis was that the description field somehow influenced the placement of the distance-azimuth line features. We had included nominal data that separated each feature as a light pole or tree or bench, but when we included this information in the tools it completely changed the locations. Because of this problem, we decided to not include the nominal data into the final analysis. 


Conclusion


While the use of a GPS would have made this type of data collection much quicker, this exercise proves that collecting accurate locational data can be done without needing advanced satellites and equipment, and can ideally be done with only a compass and tape measurer. In a dense forest, it becomes difficult for a GPS unit to receive signals from a satellite. By using the distance azimuth method, the measurements are as accurate as you make them, and cannot be influenced by any interference.